What information is got from the Temperature (BBT) Chart?
The basal body temperature (BBT) graph can give three pieces of information:
- That ovulation has occurred.
- That ovulation has not occurred.
- It can confirm pregnancy
The Temperature Chart can confirm that ovulation has occurred:
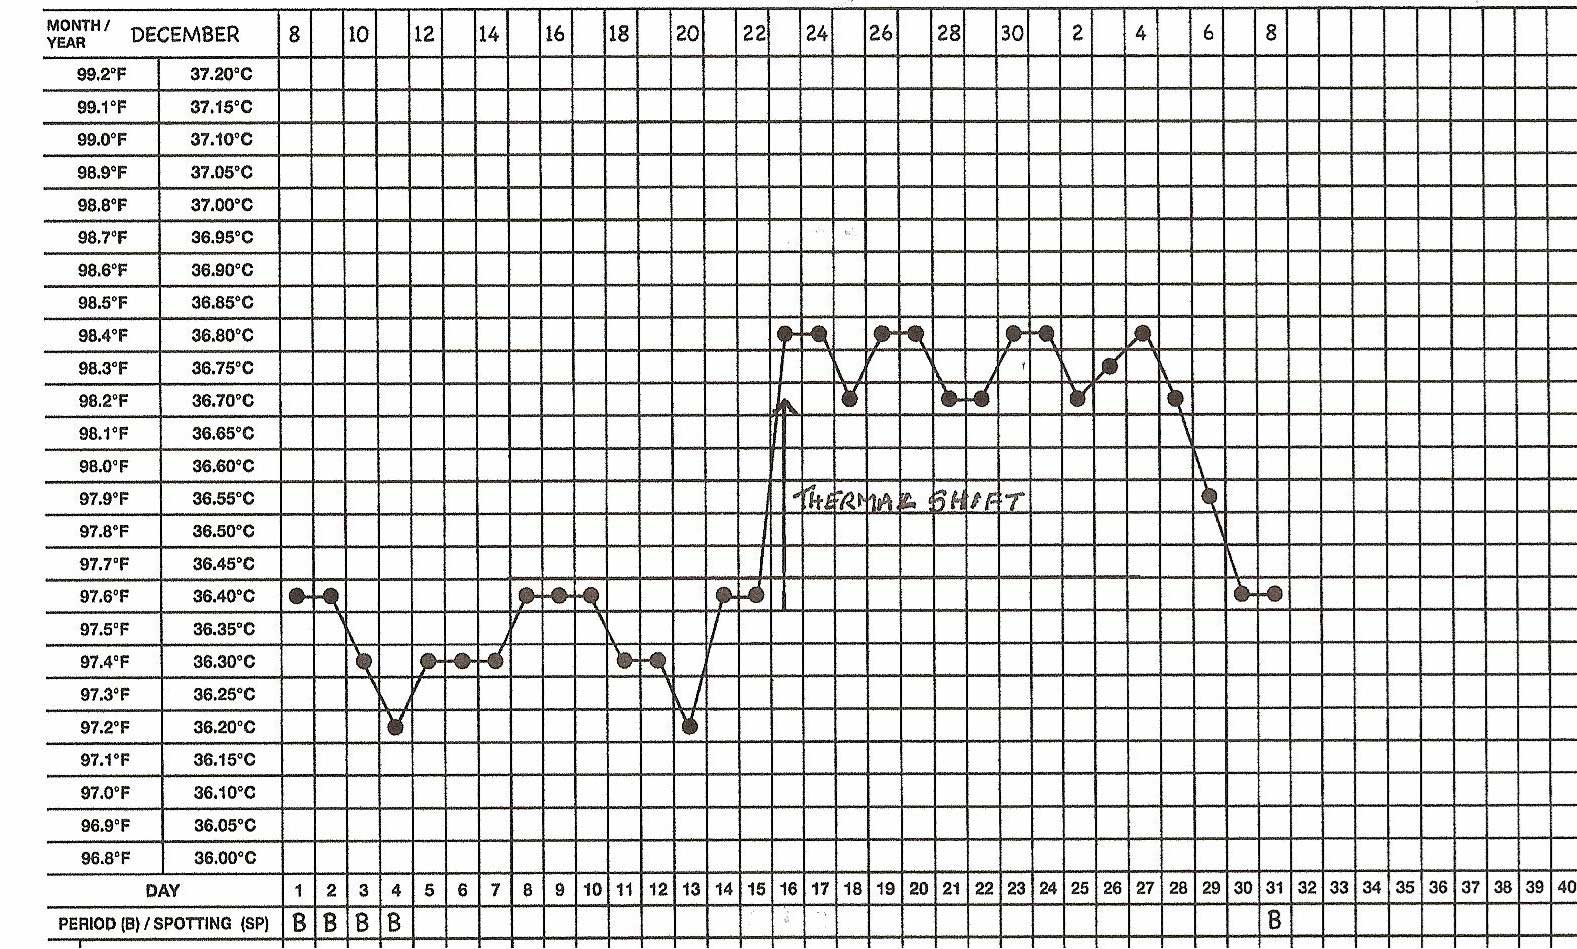 Fig. 12-1; Biphasic Temperature Chart: This temperature chart is annotated for both Centigrade and Fahrenheit thermometers. Each square on the Centigrade scale is equal ato 0.05°C, and each square on the Fahrenheit scale is equal to 0.1°F. Day 1 of the cycle, marked on the bottom of the chart, is the first day of menstruation, (marked B). The last day of the cycle (Day 30) is the day before the next menstruation begins which is on Day 31 (marked B). The woman takes her temperature every morning at the same time and records it in the middle of the square. On Day 15 there is a rise in temperature and it remains elevated until Day 30 due to the action of progesterone. Ovulation occurred sometime between Day 15 and Day 16. Progesterone maintains the endometrium and as pregnancy did not occur in this cycle the corpus luteum atrophies causing a drop in progesterone. The endometrium is no longer maintained and is shed as the menstrual period. The luteal phase from Day 16 to Day 30 is usually constant in length (on average about 14 days), and reflects the level of progesterone in the blood and the life-span of the corpus luteum. Day 31 is the first day of menstruation of the next cycle and is Day 1 of the new cycle.
The Temperature Chart can confirm that ovulation has not occurred:
A temperature chart showing a lower phase followed by a higher phase is known as a biphasic temperature chart, and indicates that ovulation occurred. The point at which the temperature chart rises to a higher level (i.e. becomes biphasic) is called the thermal shift. (Fig. 12-1) A temperature chart that shows no rise in temperature is called a monophasic temperature chart and indicates that ovulation did not occur in that cycle. (Fig. 12-2)
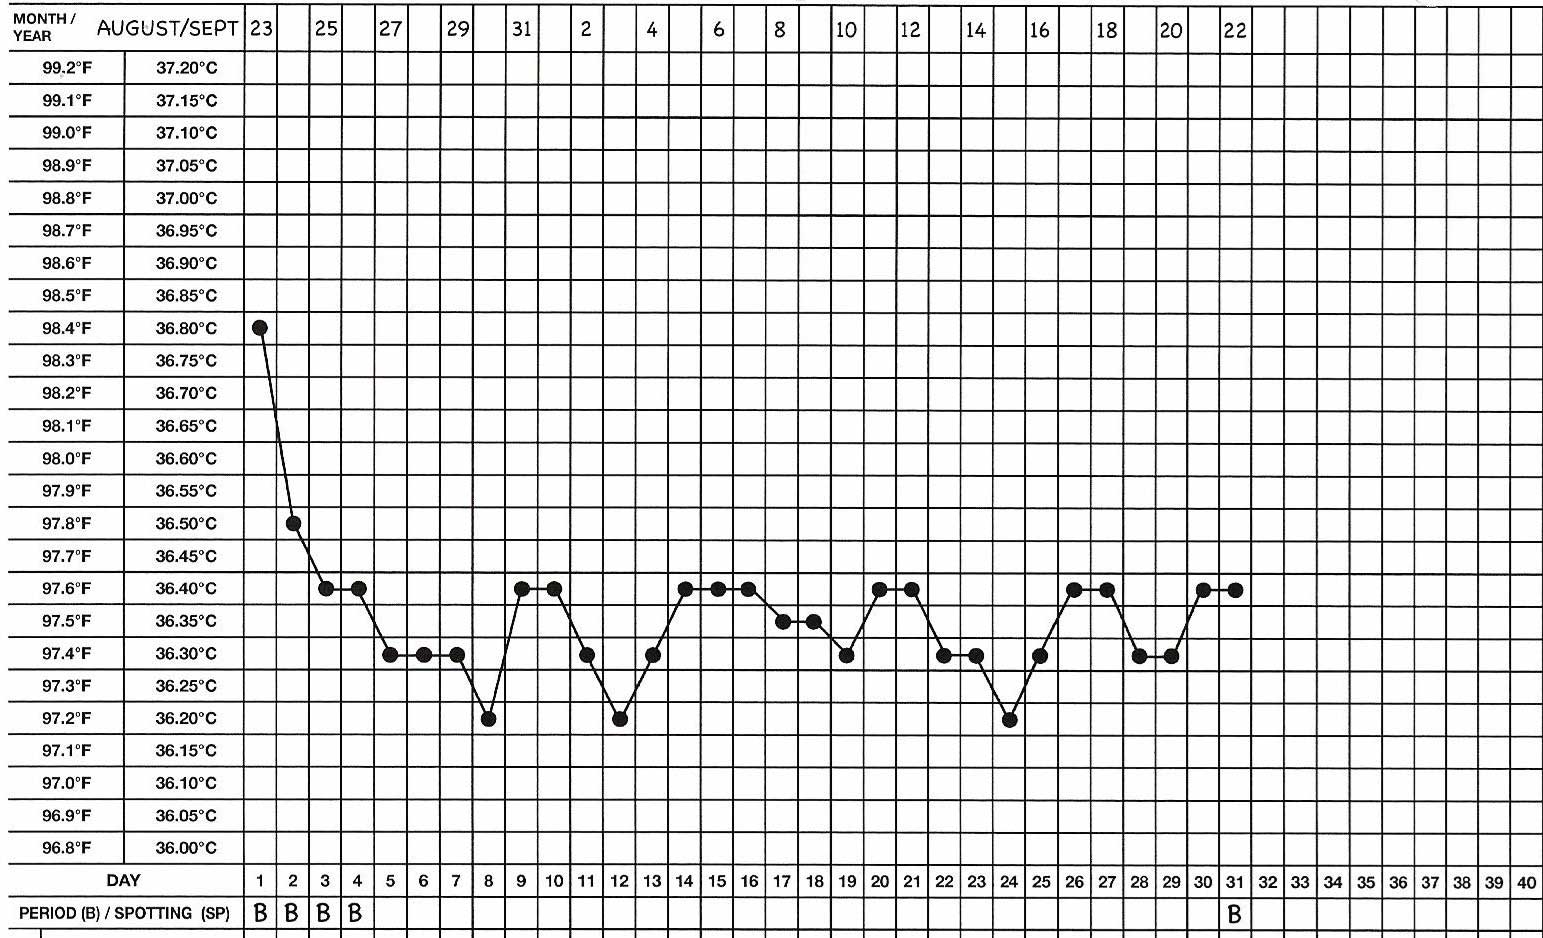
What does the monophasic chart indicate?
Temperature chart can help confirm pregnancy:
How is the Temperature Chart used to define the beginning of the Infertile Phase after ovulation?
(i.e. the ‘second infertile phase’/ ‘definitely infertile phase’ of the cycle):
The sustained rise in basal body temperature after the thermal shift is due to progesterone from the corpus luteum after ovulation, and confirms that ovulation has occurred. After ovulation the ovum lives for 24 hours and when the ovum dies the woman is infertile. The second infertile phase of the cycle after ovulation is called the definitely infertile phase as the woman cannot get pregnant in this phase as the ovum is dead and no further ovulation will occur in that cycle. According to the RULES of the symptothermal double-check method of Natural Family Planning (NFP), two fertility indicators, ‘BBT’ and ‘cervical mucus’ whichever comes last, are used to define the onset of the ‘definitely infertile phase’. The woman must be taught these Rules by a qualified NFP teacher. The definitely infertile phase ends on the day before the next menstrual period, as the first day of the period is ‘Day 1’ of a new cycle.

